
Arjun sat at his study desk, surrounded by newspapers. One headline shouted, “India Becomes the World’s Fourth Largest Economy,” overtaking Japan. Another headline on the very next page worried about “Low Consumption Demand” and “Jobless Growth”. “How can we be growing so big and yet struggling at the same time?” Arjun muttered, frustrated. “That, my friend,” said his mentor, entering the room, “is because you are looking at the cover of the book, not the pages inside. To understand the Indian economy, you must master the alphabet of Macroeconomics: GDP, GNP, NDP, and NNP Explained.”
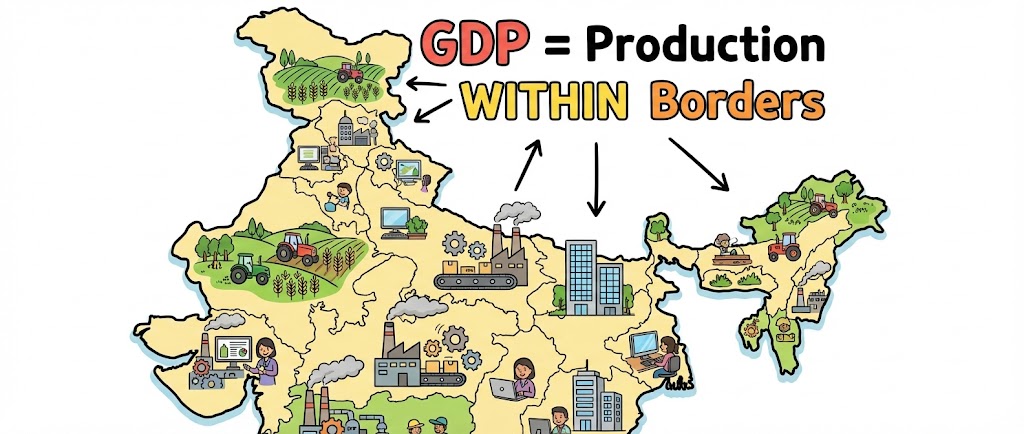
GDP: The “Domestic” Boundary #
Think of GDP as everything produced inside the factory walls (India’s geographical borders), regardless of who owns the machines. GDP is the total market value of all final goods and services produced within the domestic territory of a country during a specific period (usually a year). The “Domestic” Catch: It includes production by foreign companies located in India (like a Chinese phone factory in Noida) because the production happens on Indian soil.
Final Goods Only: We only count the bread, not the flour sold to the baker. Counting the flour and the bread would be “double counting”.
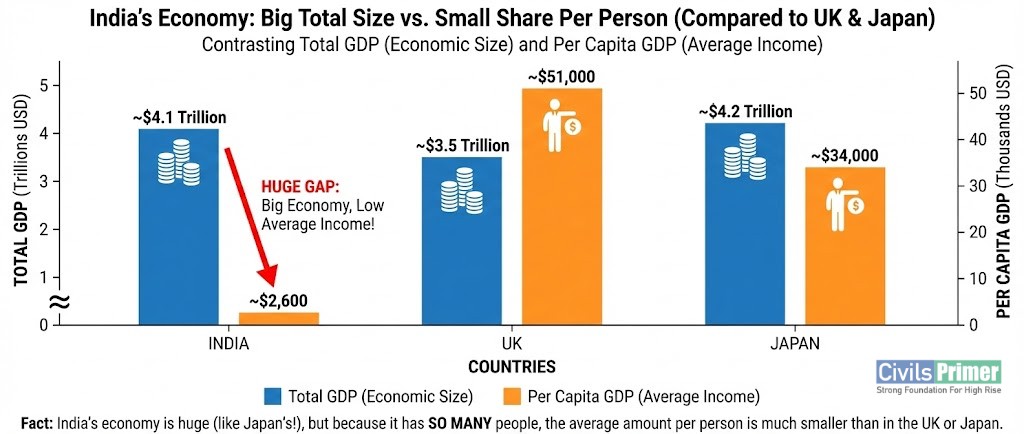
The Context from 2025: Current data estimates India’s GDP in 2025 at roughly $4.18 trillion. However, relying solely on this number can be misleading. While the total size is huge, it doesn’t account for the cost of living differences. This is why we also look at Purchasing Power Parity (PPP). In PPP terms, India became the third-largest economy way back in 2009.
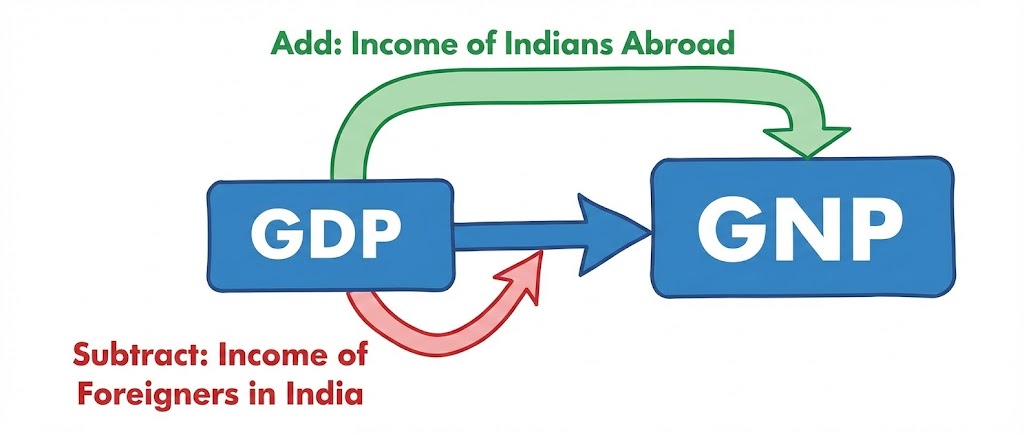
GNP: The “National” Pride #
Now, imagine the factory owners. Some Indians live and work outside the factory walls (abroad), and some foreigners work inside our factory. GNP cares about the nationality of the producer, not the location.
- The Shift from GDP to GNP: To get GNP, we take GDP, add the money Indians earn abroad, and subtract the money foreigners earn in India.
- Formula: GNP = GDP + Net Factor Income from Abroad (NFIA).
- The Logic: If an Indian software engineer earns a salary in London, it adds to India’s GNP (but not GDP). If a US bank makes a profit in Mumbai, it is subtracted from India’s GNP.
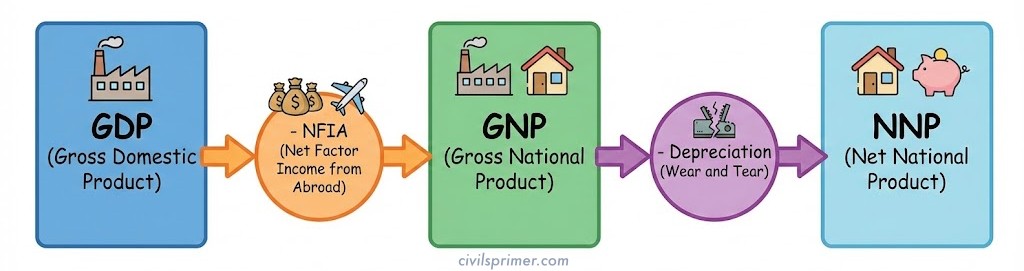
NDP and NNP: The Wear and Tear #
Imagine our factory produced 100 loaves of bread last year at ₹10 each (Total = ₹1000). This year, it produced the same 100 loaves, but the price rose to ₹20 (Total = ₹2000). The factory didn’t grow, but the money doubled!
- Net Domestic Product (NDP) = GDP – Depreciation.
Story Insight: This indicator tells us how much we need to spend just to keep our economy running at the same level. - Net National Product (NNP) = GNP – Depreciation.
The Holy Grail: NNP at Factor Cost is what we officially call “National Income”. It is the purest form of income calculation, stripping away taxes and Depreciation to show what the people actually earned. - The Verdict: For measuring economic growth, Real GDP is the true indicator, not Nominal GDP
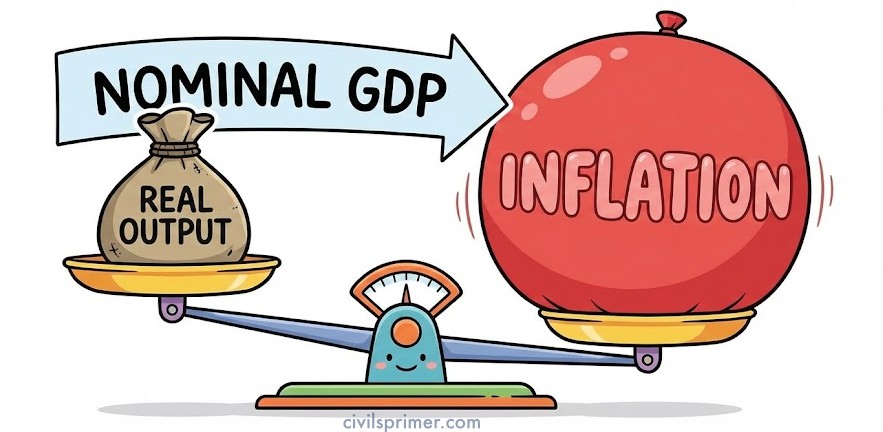
Nominal vs. Real GDP: The Mirage of Money #
Arjun looked at a report from the Ministry of Finance describing the economy as being in a “Goldilocks Moment“—not too hot, not too cold. “But sir, if prices of vegetables double, the GDP number will go up even if we produce the same amount of vegetables. Is that real growth?” Arjun asked. “Brilliant question,” the mentor smiled. “That brings us to the most important distinction for National Income Concepts for UPSC Exam.”
- Nominal GDP: This is the GDP calculated at current market prices. It includes the effects of inflation. If prices rise, Nominal GDP rises, even if production is stagnant.
Current Context: In 2025, low inflation actually posed a problem for the government’s fiscal arithmetic. Lower inflation meant Nominal GDP growth slowed down, which reduced tax revenues. - Real GDP: This is calculated at constant prices (using a Base Year). It removes the illusion of inflation. It shows the actual increase in goods and services.
GDP Deflator: The Truth Teller #
“So, how do we know how much of the growth is just price rise?” Arjun asked.
“We use the GDP Deflator,” the mentor replied.
- Formula: (Nominal GDP / Real GDP) × 100.
- Concept: It measures the impact of inflation on the gross domestic product. Unlike the CPI (which only looks at a basket of consumer goods), the GDP Deflator covers all goods and services produced in the economy.
The 2025 Dilemma: While low inflation sounds good for consumers, persistently low inflation (CPI at 2.07% in late 2025) meant the GDP Deflator was low. This made the government’s debt-to-GDP ratios look worse because the “value” of the economy wasn’t inflating as fast as expected.
Per Capita Income: The Average Citizen #
“India is the 4th largest economy. So, are we rich?” Arjun asked hopefully.
The mentor sighed. “Imagine a family of 4 earning ₹1 lakh, versus a family of 20 earning ₹1.5 lakh. Which family is richer?”
“The family of 4,” Arjun replied.
“Exactly. India has a huge population. Per Capita Income is the total National Income divided by the total population.”
- The Reality Check: In 2025, while India is a top economy in aggregate, its Per Capita Income rank in PPP terms is 127th among 196 countries.
- New Developments: To understand this better, India is launching its first-ever Household Income Survey in 2026 to measure income distribution accurately, as past surveys only measured consumption.
Methods: Calculating the Wealth #
“How do they actually count all this money?” Arjun wondered.
“There are three ways, essentially looking at the same coin from three sides,” the mentor explained.
- Product Method (Value Added): We calculate the aggregate value of goods and services produced by all firms. To avoid double counting (like counting wheat and flour and bread), we only count the Value Added at each stage. (e.g., Farmer grows wheat -> Miller makes flour -> Baker makes bread). This avoids double counting.
- Income Method: We sum up the incomes earned by the four factors of production: Rent (Land), Wages (Labor), Interest (Capital), and Profit (Entrepreneurship)
- Expenditure Method: Adding up all spending (Consumption + Investment + Government Spending + Net Exports).
- Formula: GDP = C + I + G + (X – M)
- C: Consumption by households.
- I: Investment by businesses.
- G: Government spending
- X-M: Net Exports (Exports minus Imports)
Current Affairs Update – SNA 2025: The world is moving beyond simple GDP. The System of National Accounts (SNA) 2025 adopted by the UN now integrates “Natural Capital Accounting.” It treats the depletion of minerals and forests as a cost and renewable energy as an asset. India is preparing for this by using data from Time Use Surveys to account for women’s unpaid work.
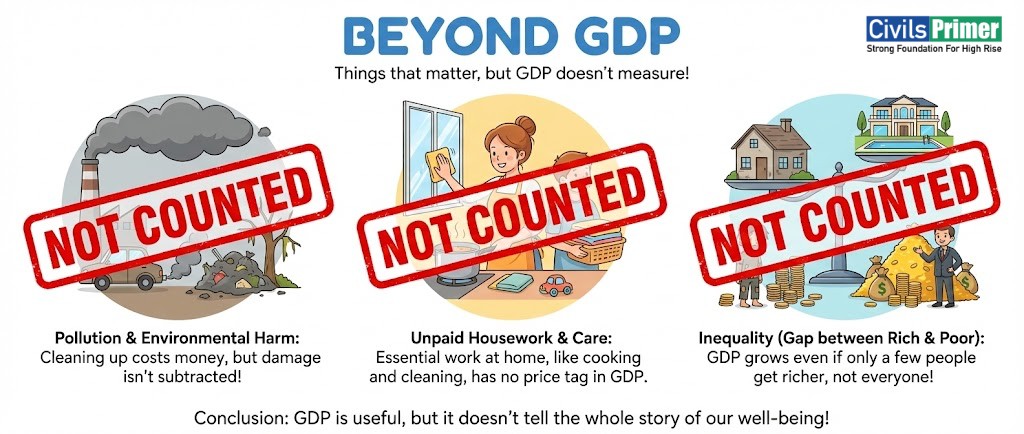
Limitations: What GDP Misses #
“Arjun, if you cut down a forest and sell the timber, GDP goes up. But have we really progressed?” “No, we lost the forest,” Arjun replied. While GDP is the most popular metric, it is not perfect. Limitations of GDP:
- Ignores Environmental Damage: It treats the exploitation of natural resources as income, not Depreciation.
- Ignores Inequality: A high GDP can hide the fact that the top 1% hold 22% of the national income, while the bottom 50% earn less than 15%.
- Ignores Unpaid Care Work: The household work done primarily by women is not counted, even though the economy would collapse without it.
- Ignores Social Welfare: Health, education, and happiness are not directly measured.
Indicators: The Indian Economic Dashboard #
“To track our health daily, we don’t just weigh ourselves once a year,” the mentor concluded. “We check our pulse, temperature, and blood pressure. Similarly, India uses high-frequency indicators.”
- IIP (Index of Industrial Production): Measures growth in various sectors like mining, electricity, and manufacturing. In 2023-24, manufacturing GVA grew by 11.89%.
- CPI (Consumer Price Index): Measures retail inflation (what you pay at the shop). This is the anchor for RBI’s monetary policy.
- PMI (Purchasing Managers’ Index): Indicates if businesses are expanding or contracting.
- Financial Inclusion Index (FI Index): Measures access to banking. It improved to 67 in 2025, driven by digital usage.
Conclusion: “Arjun, GDP is just a number. But knowing the difference between Nominal and Real, or why Per Capita matters, helps you understand the story behind the number. As a civil servant, you must focus on Inclusive Growth—where the rising tide actually lifts all boats, not just the yachts.”
Comparison of All (GDP, GNP, Deflator, Gini etc) #
| Concept | Key Difference/Definition | UPSC Prelims Pointer |
| GDP | Production within domestic territory. | India is the 4th largest economy (Nominal). |
| GNP | Production by nationals (citizens). | Includes remittances (India is top receiver). |
| Real GDP | Adjusted for inflation (Base Year). | True indicator of economic growth. |
| GDP Deflator | Ratio of Nominal to Real GDP. | Measures overall inflation in the economy. |
| SNA 2025 | New UN Accounting framework. | Includes Natural Capital & Unpaid work. |
| Gini Index | Measures Inequality. | India’s Gini is debated (Consumption vs Income). |
Mains PYQs #
National Income Accounting: GDP, GNP, NNP
- 2021: Explain the difference between computing methodology of India’s Gross Domestic Product (GDP) before the year 2015 and after the year 2015.
- 2021: Do you agree that the Indian economy has recently experienced V-shapes recovery? Give reasons in support of your answer.
- 2020: Define potential GDP and explain its determinants. What are the factors that have been inhibiting India from realising its potential GDP?
- 2019: Do you agree with the view that steady GDP growth and low inflation have left the Indian economy in good shape? Give reasons in support of your arguments.
- 2017: “Industrial growth rate has lagged behind in the overall growth of Gross-Domestic-Product (GDP) in the post-reform period” Give reasons. How far are the recent changes in Industrial Policy capable of increasing the industrial growth rate?
- 2017: Among several factors for India’s potential growth, the savings rate is the most effective one. Do you agree? What are the other factors available for growth potential?
- 2015: The nature of economic growth in India is described as Jobless Growth. Do you agree with this view? Give arguments in favour of your answer.
Answer Writing Minors #
Common Introductions (Choose one based on the question tone)
Option 1: The Standard “Definition & Significance” Approach
National Income Accounting serves as the macroeconomic scorecard of an economy, quantifying the aggregate economic activity through metrics like GDP, GNP, and NNP. These indicators are not merely statistical tools but are fundamental for policymakers to assess economic performance, allocate resources, and formulate developmental strategies.
Option 2: The “Growth vs. Welfare” Approach (Good for critical analysis)
While Gross Domestic Product (GDP) is the most widely used benchmark to gauge a country’s economic size, it is primarily a measure of production rather than holistic well-being. Understanding the nuances between domestic output (GDP) and national income (NNP) is crucial to analyzing the true structural transformation and standard of living in a developing economy like India
Common Conclusions (Choose one based on the question tone)
Option 1: The “Sustainable & Inclusive” Way Forward
While rising GDP numbers indicate economic expansion, true development is achieved only when growth translates into improved social indicators. To ensure the welfare of the masses, India must move beyond mere quantitative aggregates toward “Inclusive Growth” and sustainable metrics like Green GDP, which account for environmental costs and income inequality.
Option 2: The “Structural & Policy” Perspective
Ultimately, National Income estimates are vital for assessing the success of economic planning and fiscal policies. However, for India to realize its potential, these numbers must be complemented by structural reforms that bridge the gap between economic growth and employment generation, ensuring the fruits of development reach the bottom of the pyramid.
Related Current Affairs #
National Income Accounting – GDP, GNP, NNP
| (September, 2025): Annual Survey of Industries (ASI) Results 2023-24 Released MoSPI released ASI results showing Gross Value Added (GVA) grew by 11.89% over the previous year. ASI data is a critical economic indicator used in National Income calculation to determine the contribution of the organised manufacturing sector to the economy. |
| (August, 2025): Adoption of System of National Accounts (SNA) 2025 The UN Statistical Commission adopted SNA 2025 to replace the 2008 framework. It expands the boundaries of GDP calculation to include “natural capital accounting,” “unpaid household work,” and “distributional accounts” to better measure well-being and sustainability beyond mere economic output. |
| (July, 2025): India’s First-Ever Household Income Survey Announced MoSPI announced a dedicated Household Income Survey for 2026 to fix data gaps in Per Capita Income and inequality measurement. Previously, India relied on “consumption expenditure” as a proxy for income, which often underestimated true income disparity. |
| (July, 2025): Debate on Nominal GDP vs. Purchasing Power Parity (PPP) While IMF data projects India as the 4th largest economy by Nominal GDP (4.18trillion),it ranks 3rd by PPP (17.65 trillion). This highlighted the difference between output measured at market exchange rates (Nominal) versus cost-of-living adjustments (PPP). |